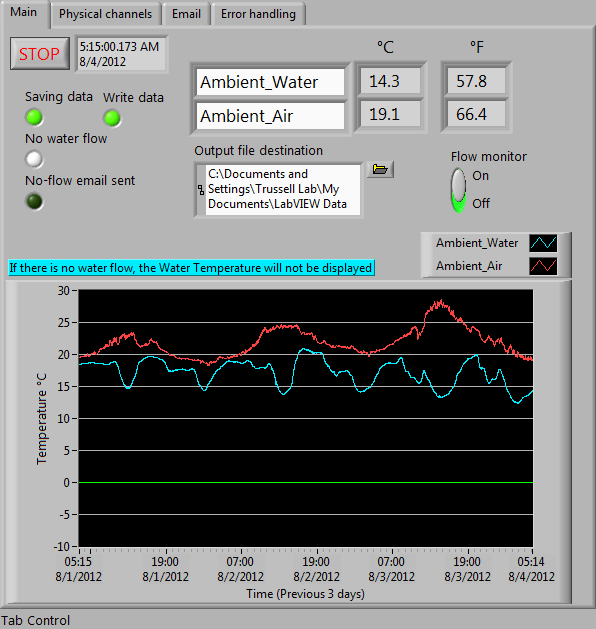
Seawater status:

 Archived temperature data:
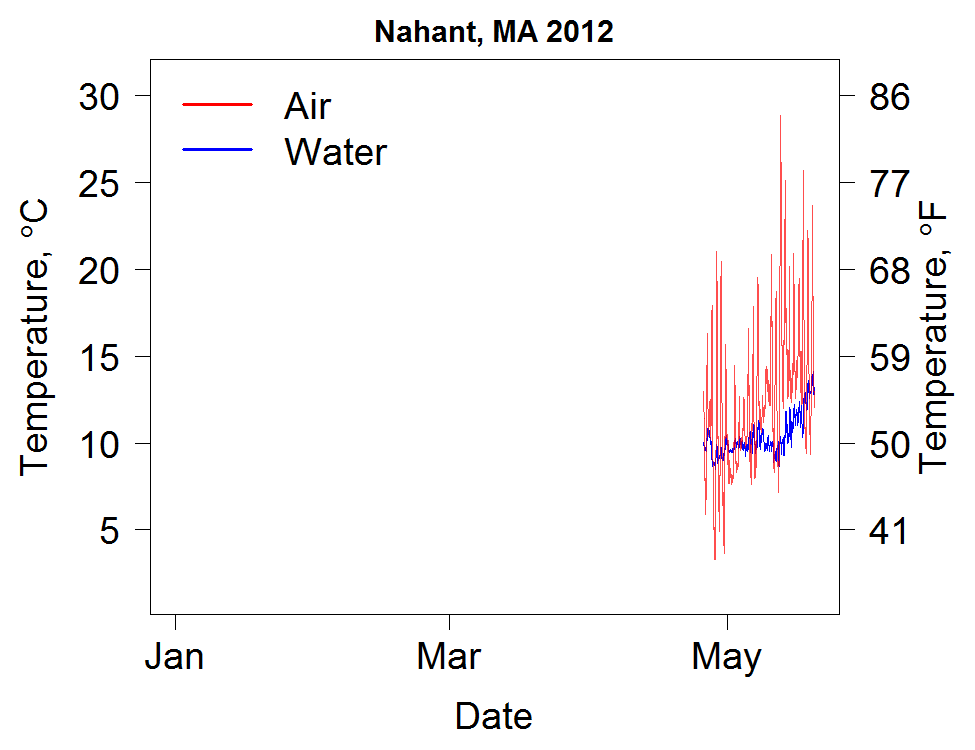 Notes:
Archived data are stored in 4-column comma-separated-value files. The first
column (TimeEST) is the time of the measurement in Eastern Standard Time
(GMT-5:00). There is no daylight-savings time adjustment in these files. The
second and third columns are the seawater temperature and air temperature,
respectively, in degrees Celsius. Missing data are denoted with a NA.
The 4th column indicates the
water flow status in the Marine Science Center seawater system, 1 for flowing,
0 for no-flow. Water temperatures are not recorded during no-flow periods, as
the water around the sensor tends to warm up.
Water temperature is recorded in a bucket being fed by the seawater system, as
shown in this post.
Air temperature is recorded by a TMP36 temperature sensor set outside the
building under a table for shade. This is not nearly as good as a real weather
station sensor, but beggars can't be choosers.
Data in the current year's file will be updated as I get around to it.
Below is some example R code to open the data file, format the date/time
correctly, and plot the water or air temperatures.
Notes:
Archived data are stored in 4-column comma-separated-value files. The first
column (TimeEST) is the time of the measurement in Eastern Standard Time
(GMT-5:00). There is no daylight-savings time adjustment in these files. The
second and third columns are the seawater temperature and air temperature,
respectively, in degrees Celsius. Missing data are denoted with a NA.
The 4th column indicates the
water flow status in the Marine Science Center seawater system, 1 for flowing,
0 for no-flow. Water temperatures are not recorded during no-flow periods, as
the water around the sensor tends to warm up.
Water temperature is recorded in a bucket being fed by the seawater system, as
shown in this post.
Air temperature is recorded by a TMP36 temperature sensor set outside the
building under a table for shade. This is not nearly as good as a real weather
station sensor, but beggars can't be choosers.
Data in the current year's file will be updated as I get around to it.
Below is some example R code to open the data file, format the date/time
correctly, and plot the water or air temperatures.
# Filename: open_MSC_temps_file.R
#
# Author: Luke Miller   Jun 5, 2011
###############################################################################

#Open the csv data file
df = read.csv(file.choose(),
    colClasses = c('character','numeric','numeric','numeric'))

#Next convert the time stamps to POSIXct time values
df$TimeEST = as.POSIXct(df$TimeEST, format = "%m/%d/%Y %H:%M" )

#Plot the water temperatures
plot(df$TimeEST, df$Ambient_Water, type = 'l', col = 'blue',
    xlab = 'Date',
    ylab = expression(paste('Water Temperature, ', degree,'C')),
    las = 1)

#Plot the air temperature (this will overwrite the previous plot if you run
#it immediately.
plot(df$TimeEST, df$Ambient_Air, type = 'l', col = 'red',
    xlab = 'Date',
    ylab = expression(paste('Air Temperature, ', degree, 'C')),
    las = 1)